By Stella Aslibekyan, Briana Cameron and Teresa Filshtein
A recent 23andMe blog post explored the old adage “you are what you eat,” examining the relationship between eating habits and their health outcomes.
However, we wanted to explore another dimension of the data. We wanted to see if where you live is associated with what you eat. So rather than looking at “you are what you eat,” we want to see whether “You eat where you are.”
Dietary Geography
Years of scientific research have brought us to the almost undeniable conclusion that the food you eat affects health outcomes, especially later in life. However, dietary habits can be influenced by many different factors. Some of those factors include personal food preferences, local policy, availability of options, and cultural ones, like the habits of those around us. (See our new paper on dietary habits research and the sidebar to this post, “A New Recipe for Nutritional Studies.”)

Being aware of external factors influencing your dietary habits could be a first step to making changes that might reduce your risk of adverse health outcomes such as type 2 diabetes, obesity, cardiovascular events, accelerated aging, and more.[1] One external factor is location, as public health research has shown how “food deserts” — urban and rural neighborhoods without grocery stores — have contributed to poor health outcomes. At 23andMe, we have a unique opportunity to explore the connections between diet and geography.
Our scientists analyzed data from more than 750,000 23andMe customers who consented to participate in the research and shared details about their eating habits. Our results focused on four major food categories: vegetable and fruit intake, sugar intake (added sugar intake and sugar-sweetened beverages), red meat intake, and dairy intake. Vegetables, fruit, and dairy were measured in cups per day; sugar was measured in teaspoons per day, and red meat was measured in times eaten per day.
We found distinct differences in eating habits among broad regions in the United States and between urban and rural environments.
Dietary Habits in the US
The map clearly shows that people in the West and Northeast eat more fruit and vegetables, while those in the Central and Southern U.S. eat more sugar. Below are some nutrition maps across the U.S. Each map represents a visualization of self-reported consumption by county. In each map, red indicates consumption levels associated with BMI increases.
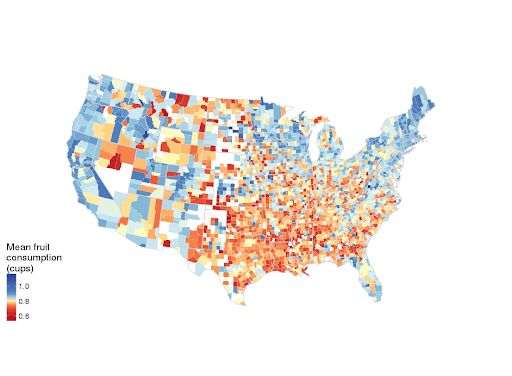
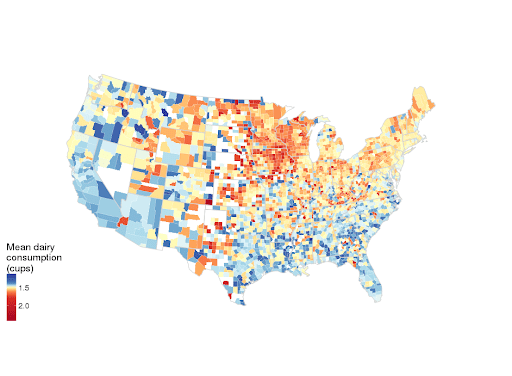
The maps represent the average self-reported consumption of each dietary factor at the county level; counties with less than 5 participants were not evaluated and show up in white on the map to protect our participants’ privacy.
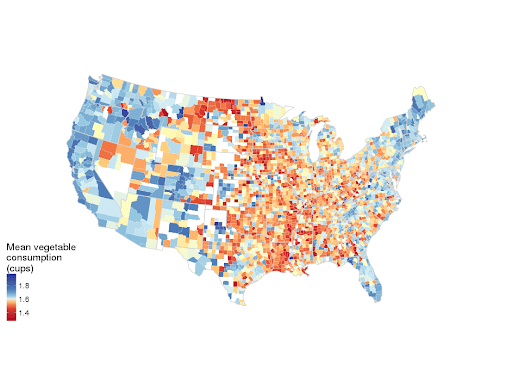
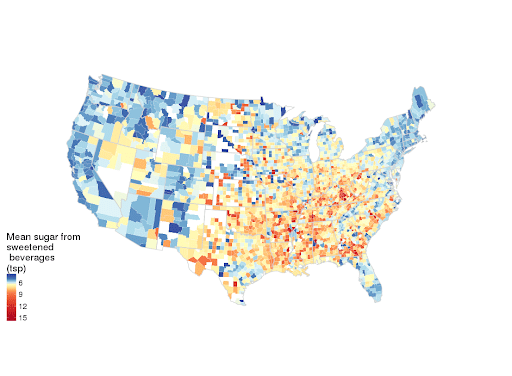
Each map is scaled such that the color shift occurs at the median. Gradients within color are based on quantiles, so extremes (bottom and top 5 percent of the population) are darkest.
The Rural Effect
A New Recipe for Nutritional Studies
Something so elemental as food shouldn’t be so complicated. Still, it is often confusing to scan through the conflicting coverage about what is and what isn’t healthy to eat.
Is sugar toxic? Is coffee good or bad for you? And what about red meat and eggs?
Diet and nutrition are difficult to study. But studying what we consume is critical for understanding because of how and what we eat impacts our health. This understanding is especially true as the implications of diet-related conditions like obesity, Type 2 diabetes, and heart disease rise to epidemic proportions. That’s what makes nutritional studies — as well as better ways of powering those studies — so critical.
This week, 23andMe published a paper describing our unique approach to these kinds of observational studies, which make up a cornerstone of nutrition research. With millions of individuals who have consented to participate in research and answer questions about their daily eating habits, 23andMe’s can quickly collect nutritional information in real-time.
Using this data with other health-related information can help inform studies that look at the impact of different diets on different populations, identify trends, and spot correlations. For example, we’ve spotted seasonal dietary changes, differences in diet between men and women, and people of different age groups. We’ve also looked at correlations between different kinds of diets and exercise frequency.
Most recently our researchers looked at geographic differences in the United States and diet. This helped illuminate not just the differences in diet between urban and rural populations but also the differences in lifestyles between these communities. Looking at these different types of data in different ways allows scientists to explore the complicated relationship between diet, lifestyle, and health.
In our new paper, we demonstrate 23andMe’s ability to quickly and contemporaneously collect nutritional data for fast assessment of trends. We can do this much faster and at a much larger scale than traditional approaches like those of the CDC’s National Health and Nutrition Examination Survey (NHANES).
“23andMe created an opportunity for very large, rapid-scale, and real-time data collection, which may inform national nutritional trends and future epidemiologic studies in a much shorter time frame than ever before,” said Stella Aslibekyan, Ph.D., a co-author of the paper and Senior Scientist at 23andMe.
Although 23andMe customers are not exactly representative of the population as a whole, as 23andMe grows and diversifies, findings drawn from this data will be more applicable to the population as a whole. The next step will be adding genetic data and this, in turn, will help in learning more about how genetics and changes in dietary habits and lifestyle can improve health and prevent chronic disease.
In addition to exploring nutritional habits by county, we also looked at the effect of living in a rural vs. urban setting on dietary habits. After adjusting for age, sex, and BMI, we saw whether you lived in a rural vs urban setting[2], which was highly associated with dietary habits across all four food types we considered. Participants living in rural environments were likelier to consume added sugar, dairy, and red meat, whereas urban participants ate more fruits and vegetables.
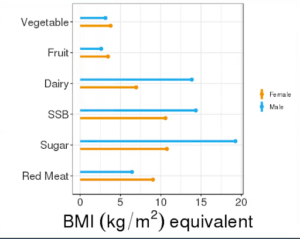
This difference in dietary behavior (i.e., the ‘”rural effect’”) is equivalent in magnitude to the increase in sugar-sweetened beverages associated with a 14-point increase in BMI in males and a 10-point BMI increase in females. Even more striking is the association with added sugar; the rural effect is equivalent to a 19-point increase in BMI in males and an 11-point increase in females. The BMI equivalence of the rural effect on red meat is 6 and 9 BMI points in males and females, respectively, and dairy consumption is 13 and 7 points for males and females. The rural effect was more pronounced in men than in women for the dairy and sugar domains and was more robust in women for red meat. (See Figure 2 for a graphical display of these results.)
While these results may seem counterintuitive, as rural settings are often where food that feeds the country is grown, studies have shown that people in these settings usually have limited access to healthy food choices. In fact, many rural communities rely on convenience stores for their food, which often offer little to no healthy options.[3] In addition, education on nutrition and funding for nutrition programs in rural schools also appears to be limited.
Discussion
23andMe’s extensive database of self-reported dietary habits allows one to study the individual and geographic factors that influence what we eat. While factors such as sex, age, and BMI can impact our nutritional habits, where you live can also be an essential contributor to your diet. Visualizations of self-reported consumption by county show striking spatial patterns across the US. Our data also suggest that living in an urban vs. rural environment can impact diet. Participants living in rural environments were likelier to consume added sugar, dairy, and red meat, whereas urban participants ate more fruits and vegetables. Good nutrition is a critical component of leading a healthy lifestyle and understanding dietary differences between urban and rural environments may potentially help address the noted health gap between urban and rural America (CDC source).
Footnotes:
[1] “How Your Eating Habits Affect Your Health | NIH News in Health.” Accessed 26 Aug. 2019.


