By Chris Gignoux and Brenna Henn
Early human history was characterized by many rapid, long-distance migrations.
But despite our beginnings as travelers, genetic evidence published online last Sunday in Nature indicates that after expanding to all corners of the earth, people (at least those in Europe) tended to stay close to home.
Principal Components Analysis
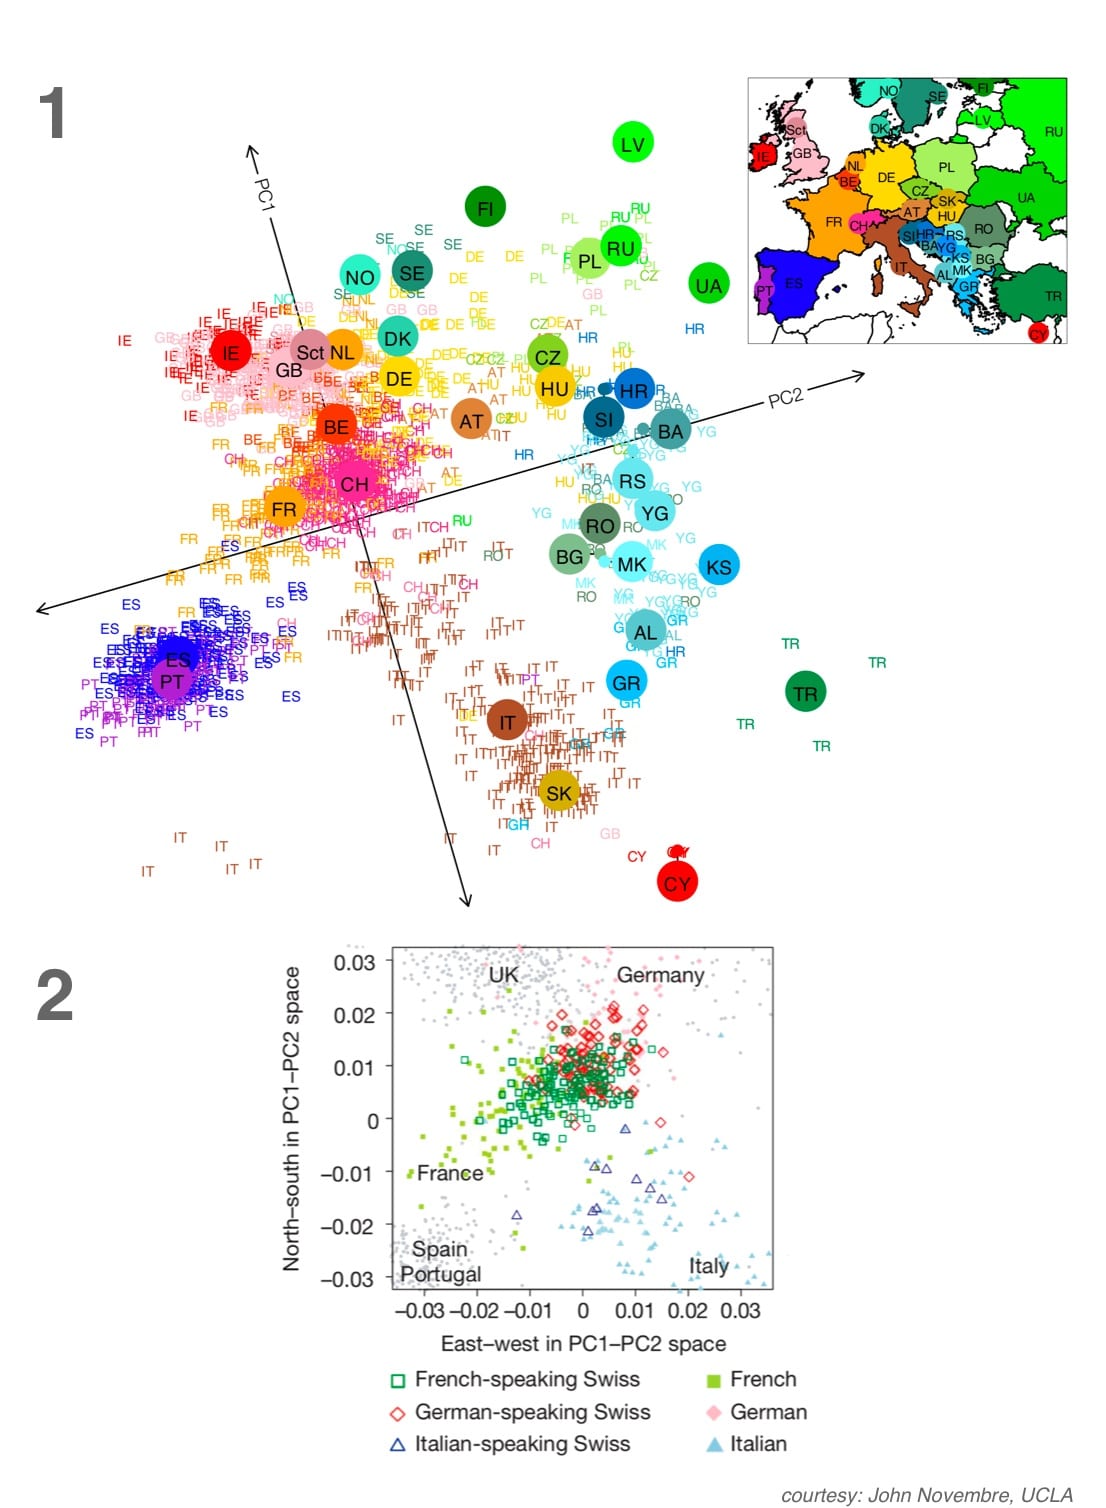
Close to similar research published just a few weeks ago (and covered in The Blog), John Novembre and colleagues have created a genetic “map” of Europe that closely mirrors the geographic map.
Their results will allow scientists to better understand how geography contributes to genetic variation, vital for genome-wide association studies and ancestry analyses.
 Figure 1: The genetic map of Europe using PCA, with the geographic map of Europe for reference. Figure 2: The same map, but zoomed in on Switzerland. Swiss individuals tend to cluster with countries that speak the same language. (Courtesy: John Novembre, UCLA)
The researchers used a mathematical technique called principal components analysis (PCA) to collapse large amounts of SNP data for 3,192 people drawn from throughout Europe into a two-dimensional “map” of their genetic distances from one another. (Figure 1)
Creating a Genetic Map
When the researchers looked at the DNA of any two individuals, they found that the number of genetic differences between them was proportional to the geographic distance that separates their respective home countries.
Even within countries, the researchers saw that groups with similar cultural histories shared identical genetics. For example, Italian speakers from southern Switzerland tended to cluster with other Italian speakers and apart from other Swiss groups. (Figure 2)Using only genetic data, the researchers could assign, on average, 50% of European individuals to within 400 kilometers of their correct country of origin. But there was one caveat: all four grandparents of an individual had to come from the same European country for the assignment to be correct. People with mixed European ancestry tended to show up between the locations of their ancestors.
The accuracy of the assignment varied greatly from country to country: some people, like the Swedes and Portuguese, were placed on the map with less precision than other groups, like the Polish and Belgians.
A Genetic Map of Europe
As in earlier research that constructed a genetic map of Europe, the results of this study show that genetic variations between people tend to follow a northwest-to-southeast path. This may reflect an ancient migration after the Last Ice Age when glacial sheets extended from northern Europe. Human groups (not to mention grasshoppers, hedgehogs, etc.) were forced to take refuge in warm southern locations like the Italian and Iberian Peninsulas. But after the glaciers melted about 15,000 years ago, humans began to re-colonize Europe, moving from south to north.
In the past, genome-wide association studies have been hampered by the effects of geography on genetics. For example, a study looking for DNA variants associated with height found spurious evidence of linkage to SNPs that are actually linked to lactose tolerance because both traits vary along the same NW/SE axis in Europe. The results of this study current study and others like it will help scientists correct their data and increase their ability to detect true associations.