
By Rafaela Bagur Quetglas, PhD

You are what you eat, is the old adage, but what does your diet actually say about you?
23andMe has a unique opportunity to explore that question, as we investigate how dietary habits, along with genetics, demographics, lifestyle and other data can influence overall health outcomes.
Looking at diet specifically, our scientists analyzed the data of more than 850,000 people who consented to participate in research and who shared details about their own eating habits.
Using machine learning techniques* we were able to see that dietary choices clustered into four distinct types of eaters, which were mainly characterized by two dietary behaviors. The first one represents the spectrum of foods’ nutrient content from high nutrient-dense foods (i.e. low caloric foods with high nutrient content like vegetables, leafy greens, fruit, beans or whole-grains) to low nutrient-dense foods (i.e. high caloric foods with low nutrient content like. processed foods, sweets, sodas, pastries, saturated fats or fast food). The second main behavior differentiating diet groups is the meat intake, in particular, red and processed meat (e.g., sausages, hot dogs, ham, or cured bacon).
Dietary Types
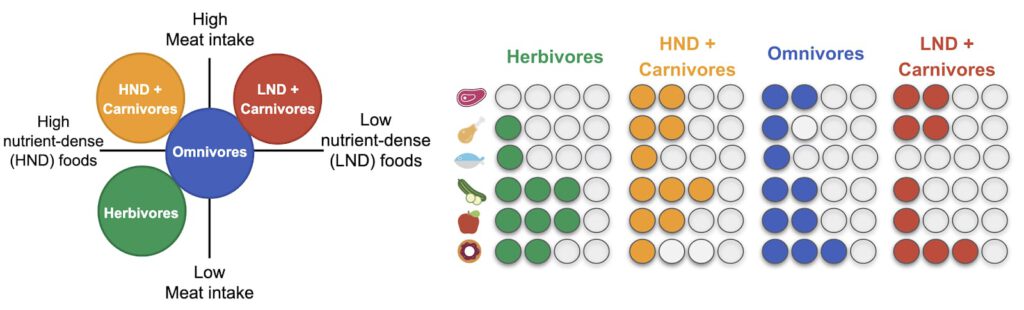
Using these two behaviors as axes, we can plot the four main diet groups:
- On one end, we find people who eat high-nutrient-dense (HND) foods like vegetables, leafy greens, and fruits and tend to avoid high-calorie foods with low nutrient content like refined carbs, processed foods, saturated fats, and fast food. Depending on their meat intake, these people can be classified as HND + Carnivores (high meat intake) or Herbivores (low meat intake). Importantly, not all Herbivores are vegetarian or vegan; they just eat less meat than the other diet groups.
- Conversely, people with a diet low in vegetables, leafy greens, and fruits also tend to eat more high-calorie foods with low nutrient content and low nutrient-dense foods (LND). This group also tends to eat more meat, particularly processed and red meat (LND + Carnivores). Curiously, in this study we couldn’t find a group of people with a diet rich in low nutrient-dense foods that have a low meat intake (group absent in the lower-right corner of Figure 1).
- Finally, the people in the middle were called Omnivores because they ate a little of everything.
Men versus Women
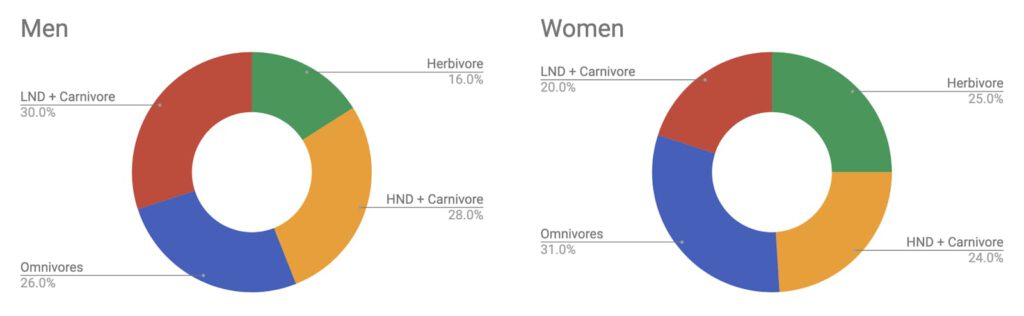
After defining these dietary clusters, we looked to see if there were any noticeable demographic differences between these groups, and there were. We found that women tend to group in the Herbivore or HND + Carnivore groups. Fewer women — only about 20 percent in our study — were in the LND + Carnivore group. In contrast, about 30 percent of men were in that group. Women also tended to eat more fruits and vegetables and avoid meat more than men. About one in four women, versus one in six men, were classified in the Herbivore group. (Figure 2)
Younger versus Older
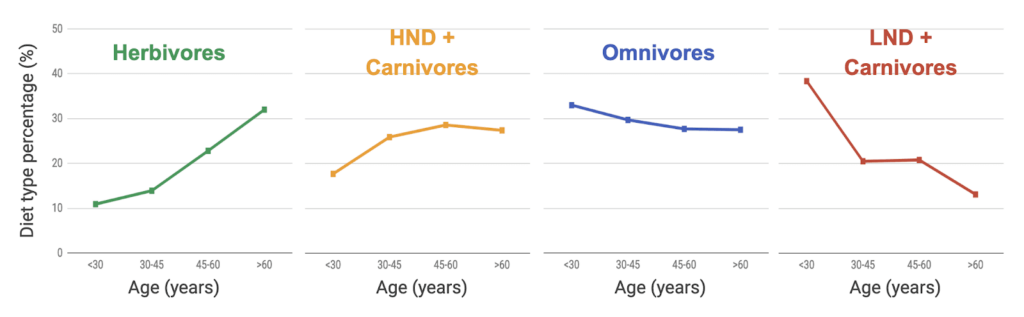
As with gender, if we look at age we also can see differences within each of the dietary classifications. In this study, younger people appeared to eat fewer fruits and vegetables and more high-calorie foods with low nutrient content. We found that about 40 percent of adults under 30 belong to LND + Carnivore category, and only about 10 percent of this age group were in the Herbivore category. The reverse is true for individuals over 60, with people in that age group more likely to eat fruits and vegetables and less likely to eat refined carbs or fast food. This is not surprising since our diets change over time — think about the difference between the typical diet of a college freshman versus the typical diet of a senior citizen.
Interestingly, when we look at Omnivores, their numbers don’t seem to change as they age. Is a part of the population resilient to changing their nutritional habits as they age? We can’t say for sure without further study (Figure 3).
BMI by Dietary Groups
We also wanted to examine how these different dietary categories might impact weight, specifically BMI. We found that individuals who ate more fruits and vegetables — Herbivores — were more likely to have a BMI in the healthy range — between 18.5 and 24.9 as defined by the Centers for Disease Control and Prevention (Figure 4). However, without exercise, those individuals in the Herbivore group were still likely to be overweight. That said, looking at our data it may be even more difficult to maintain a healthy BMI if your diet is in one of the other three dietary categories HND + Carnivore, Omnivore and LND + Carnivore.
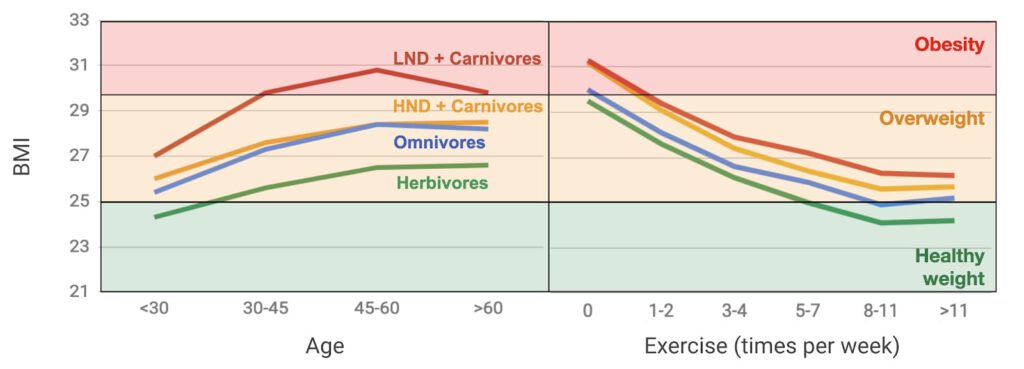
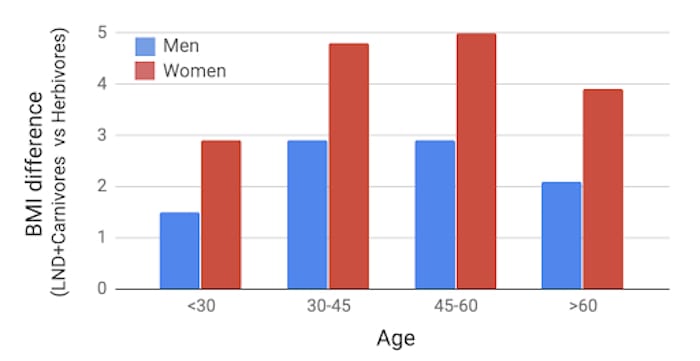
A surprising finding was that the difference in average BMI between the LND + Carnivore group and the Herbivore group is higher in women than in men. This raises the question: Is a woman’s weight more sensitive to eating high-calorie foods?
BMI by Gender
The differences between women and men in this study could be explained by many reasons. It’s important to highlight that BMI is a measure of weight adjusted for height, but it doesn’t consider body composition. The difference in BMI between men and women could be partially explained by the differences in fat storage observed in men and women [3]. On average, women have 6 to 11 percent more body fat than men. Studies show that estrogen reduces a woman’s ability to burn energy after eating, resulting in more fat being stored around the body. Experts in this field speculate that the likely reason for the differences in fat storage is to prime women for childbearing [3]. One could speculate that since gender-specific differences in fat storage exist, we might expect a fat-rich diet to impact women’s and men’s BMI differently.
Eating Behavior
This study has shed some light on the eating behaviors of the 23andMe community and how they vary by age and gender. More importantly, we have shown that diet plays a significant role in maintaining a healthy weight, which is really important for your health: The higher your BMI, the higher your risk for heart disease, high blood pressure, type 2 diabetes, and certain cancers [1], [2]. However, what you eat is not enough to define your weight since our data showed that even people in the Herbivore group need to exercise at least five times a week to have a healthy weight. In a future blog post, we will look further into the differences in activity in the 23andMe research community broken down by age, sex, and diet behaviors.
Rafaela Bagur Quetglas is a Data Scientist in Health Research and Development at 23andMe.
____________________________________
*Two machine learning techniques were used in this study. The first method, k-means clustering, was used to place people with similar diet behavior into k distinct groups; in this case, k is four. The second method, principal component analysis, identifies which dietary details set those four groups apart.
[1] Donald M. Lyall et al., (2017) Association of Body Mass Index With Cardiometabolic Disease in the UK Biobank: A Mendelian Randomization Study. JAMA Cardiol. 10.1001/jamacardio.2016.5804
[2] Bhaskaran K. et al., (2014) Body-mass index and risk of 22 specific cancers: a population-based cohort study of 5·24 million UK adults. Lancet. 10.1016/S0140-6736(14)60892-8
[3] Betty N. Wu and Anthony J. O’Sullivan (2011) Sex Differences in Energy Metabolism Need to Be Considered with Lifestyle Modifications in Humans. J Nutr Metab. 10.1155/2011/391809


