You’ve heard the family legends – or maybe you haven’t. Now 23andMe has a new ancestry feature that can show you what your genes have to say about where your ancestors originated.
This new feature, called Global Similarity: Advanced, shows you which populations from around the world you are genetically nearest to, giving you a clue as to where in the world your ancestors are likely to have lived over the last half-millennium or so.
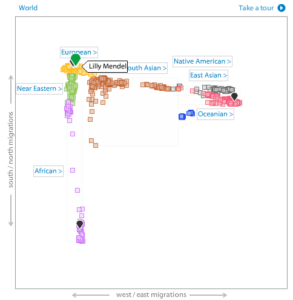 Lilly Mendel in Global Similarity: Advanced’s World view.
How does it work? Let’s take 23andMe everywoman Lilly Mendel as an example. In the image to the right she is shown as a green Google Maps-like cone on a background of colored squares, each of which represents a individual of known ancestry from our reference database.
The closer two people are on the plot, the more similar they are genetically. The genetic similarity is measured over all of Lilly’s autosomal SNPs, so it reflects the genetic contributions of all of her ancestors (unlike mitochondrial DNA, which is only inherited along the maternal line).
Lilly sits right in the middle of the European reference individuals (yellow squares), far from other reference populations like Native American and Central/South Asian; this means that Lilly’s ancestors were likely European. Lilly’s friends and family show up as black cones on the same graphic, so she can see where they each land with respect to the reference individuals and to each other.
World view shows our entire reference database at once. But Global Similarity: Advanced also lets you look at about a dozen further views, corresponding to different groupings of the world’s people. Lilly and her family are likely to be especially interested in the four European views, including Europe overall, and separate Northern, Southern, and Eastern European views.
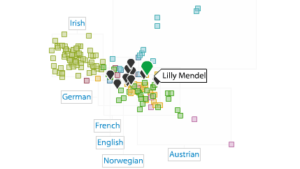
Lilly Mendel in Northern European view.
Here’s an image of Lilly and the rest of the Mendel family in the Northern European view. The same reference individuals from World view are labeled here with their countries of origin so we can get a closer look at the Mendels’ ancestry.
The Mendels tend to fall closest to German and French reference individuals, suggesting that their ancestry is quite probably Northern European, and probably a mix of a number of European peoples.
Satisfyingly, one of 23andMe’s science team was born and raised in Dublin, and he falls right in the middle of the Irish cluster of reference individuals. Another 23andMe’er has one Eastern Asian parent and one European parent; she shows up about halfway between Europe and East Asia in World view. On the plot it looks like she’s closest to Central Asian populations, but it’s really saying that she’s roughly equidistant from Europe and Asia.
If the arrangement of the clusters of people looks a bit like that of a geographic map to you, 1) congratulations on staying awake in class, and 2) this isn’t an accident. As we’ve written recently in the Blog (here and here), geneticists are learning that genetic distance corresponds rather closely with geographic distance — or at least it did until transoceanic ships and airplanes came on the scene. You can use your knowledge of geography to help interpret your results. For instance, our reference database currently doesn’t have any individuals of Korean ancestry. If you or a friend has Korean ancestry, it shouldn’t be a big surprise to find that person situated in the empty space between the Japanese and Chinese reference individuals, just as Korea is on a geographic map.
We’ve developed an animated Tour that both helps explain Global Similarity: Advanced and roughly documents the peopling of the Earth, beginning with the origin of modern humans in Africa about 200,000 years ago and their spread around the globe. Try clicking “Take a Tour” as you begin to explore the feature to start the animation. (And if you like that, be sure to give our fun and more detailed new video Human Prehistory: Prologue a try.)
The idea underlying Global Similarity: Advanced is simple enough. We calculate the genetic distances between all pairs of individuals that you’d like on the plot, again based on all the autosomal SNPs. In general, these points are arranged in some high-dimensional space, so you can’t readily picture them in two dimensions. We coax them down into two dimensions, like so: you lay all the individuals out in a plane, and move them around until the distances between each pair of points in the plane are as close as possible to the corresponding genetic distances. Once you find this optimal two-dimensional arrangement of the points, you’re done. There do arise some interesting technical issues when the rubber hits the road, and these are discussed in the feature’s white paper.
The reference database the feature is based on includes more than 1,200 individuals drawn from the CEPH-HGDP project, whose SNP genotyping 23andMe funded and made publicly available, and from Illumina’s iControlDB. This dataset does a great job at covering the breadth of human genetic diversity. Still, there are many peoples that we look forward to adding to the database to round it out, and in the near future we will be asking our customers if they wish to become part of this ancestry reference. As they say, watch this space.
Try out Global Similarity: Advanced for yourself or, if you don’t have an account yet, via one of our free demo accounts. Let us know what you think of the feature at help@23andme.com, or better yet, in the 23andMe Community!

