
Making New Year’s resolutions is a popular way to take stock of the past year and set goals to spark a positive change. This behavior is not new — as early as 4000 years ago, Babylonians reportedly made annual promises to the gods in hopes of a better year. This tradition is still going strong, as millions of Americans make at least one New Year’s resolution every year. However, almost eighty percent of these resolution-makers lose their determination by mid-February, and over one-third of Americans do not even bother with any resolutions at all. 
Why do some people take steps to make New Year’s resolutions and others do not? Why do some succeed in their resolutions and others ditch them after a short time?
Last year, 23andMe investigated this phenomenon and found genetic variants associated with making New Year’s resolutions. We did not, however, find any genetic predictors of sticking to their resolutions — likely in part due to the small sample size.
This year, our team recruited 286,601 additional participants to look for more genetic associations. Moreover, since both making and keeping resolutions are largely explained by non-genetic predictors, we also investigated and found some interesting relationships between New Year’s resolution-related behaviors and age, sex, geography, and over a thousand behavioral factors.
Resolvers and Adherers
Every March for the last four years, we have posed the same set of questions to customers who consented to participate in 23andMe research.
We asked:
- “Did you make a New Year’s resolution this year?”
If someone said “yes,” we then followed up with:
- “How well have you been able to follow your New Year’s resolution until now?”
Answers were “very well,” “well,” “average,” “poorly,” or “very poorly.”
Because some participants might have answered these two questions more than once (i.e., in different years), we merged their responses to define resolver and adherer phenotypes using the same methods as in our previous blog post. People were deemed to be “resolvers” if they ever reported making a resolution, and “controls” if they always said they refrained from doing so. Those who had made and kept the resolution were classified as “adherers” if they reported sticking with their resolutions “very well” or “well.” Those who said they performed “average,” “poorly,” or “very poorly” at adhering to their resolutions were defined as “controls.”
A total of 661,930 23andMe customers of European descent were included in this study; all had available data on New Year’s resolutions and were between 18 and 85 years of age. Approximately a quarter of our participants were classified as resolvers, and 45 percent of the resolvers were also adherers.
Age and Sex
Women were 27% more likely than men to self-identify as resolvers (odds ratio (OR) = 1.27, P-value = 2.0*e-37). But for both men and women, the probability of making resolutions declined with age (Figure 1, left panel). However, the effects of age and sex were different for adherence: women reported that they were 33% less likely to stick with their resolutions (OR = 0.67, P-value = 1.9*e-34), and the likelihood of keeping a resolution also increased with age from 18 to 70 years old and declined later in life (Figure 1, right panel).
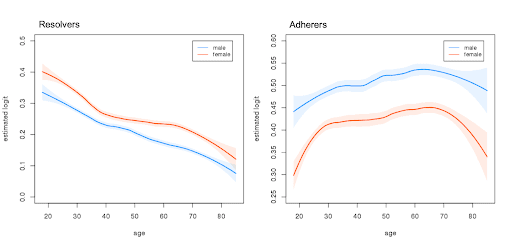
Figure 1: New Year’s resolutions and adherence by age and sex in 23andMe participants; Due to computational limitations, we randomly selected 30,000 females and 30,000 males to create these plots.
Geographic Differences
We also observed interesting regional variations. Participants from Utah (34.1%), the District of Columbia (30.2%), and California (25.8%) were the most likely to self-report making a resolution, while those from South Dakota (19.3%), Montana (20.2%), and Delaware (20.4%) were the least likely to make a resolution (Figure 2, left panel). As for being able to hold onto their New Year’s goals, individuals in the western U.S., such as Hawaii (50.1%), Idaho (49.9%) and Alaska (49.8%), were the most likely to do so, while those from South Dakota (36.2%), Maine (38.6%), and West Virginia (38.9%) had the lowest rates of adherence (Figure 2, right panel).
Residing in an urban area was also highly associated with both traits. After adjusting for age, sex, and an age*sex interaction, people living in urban areas were 20% more likely to self-identify as resolvers (odds ratio (OR) = 1.2, P-value = 9.8*e-05 ) and 8% more likely to be adherers (OR = 1.08, P-value < 2*e-16 ), compared to participants from rural areas.
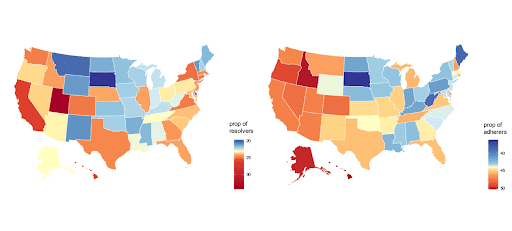
Figure 2: Regional differences across the U.S. for New Year’s resolutions and adherence; Each map represents a visualization of self-reported proportion by state, and was scaled such that the color shift occurred at the median. Gradients within a color were based on quantiles, so the darkest colors indicate the extremes (bottom and top 5% of the population).
Behaviors
To better understand factors associated with making and keeping New Year’s resolutions, we systematically evaluated associations between these two behaviors and over a thousand lifestyle, clinical and socioeconomic phenotypes. To that end, we used logistic regression adjusted for age, sex, age*sex interaction, time of cohort entry, and ancestry. Effects were expressed per standard deviation (SD) of exposure to facilitate comparisons. Based on our participants’ responses, we split our sample into three groups: resolvers who kept their resolutions, resolvers who did not, and non-resolvers. After adjusting for multiple comparisons, each of the three groups had distinct behavioral predictors (Figure 3, all P-value 0.05). For example,
- resolver & adherer: Participants who both made and stuck with their New Year’s resolutions were more likely to be conscientious (resolver: OR = 1.02; adherer: OR = 1.10), extraverted (resolver: OR = 1.04; adherer: OR = 1.06), adventurous (resolver: OR = 1.02; adherer: OR = 1.04), and have a healthy lifestyle (e.g., exercise frequently: resolver: OR = 1.03; adherer: OR = 1.09).
- resolver & non-adherer: Participants who made but did not keep resolutions were more likely to be anxious (resolver: OR = 1.01; adherer: OR = 0.95) and eat emotionally (resolver: OR = 1.03; adherer: OR = 0.91).
- non-resolver (and by definition, non-adherer): Participants who did not make resolutions were characterized by higher likelihood of neuroticism (resolver: OR = 0.99; adherer: OR = 0.90), fatigue (resolver: OR = 0.99; adherer: OR = 0.91), unhealthy eating (resolver: OR = 0.96; adherer: OR = 0.93) and not comfortable taking risks (resolver: OR = 0.98; adherer: OR = 0.96).
Overall, we observed that people who were already living a healthy lifestyle were more likely to self-report as resolvers and adherers. Conversely, those with bad habits (e.g., tobacco use, unhealthy diet) were less likely to engage with New Year’s resolutions.
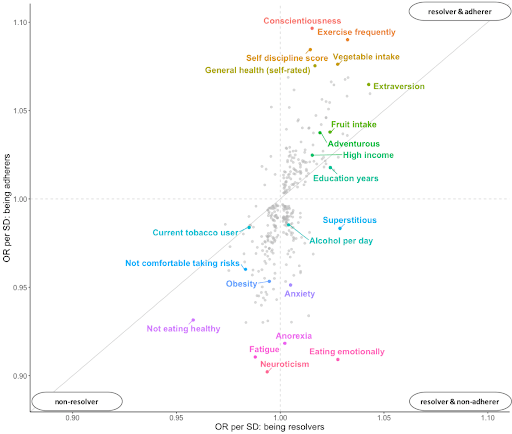
Figure 3: Associations between lifestyle, clinical, and socioeconomic phenotypes and the likelihood of being resolvers or adherers; All dots were significant phenotypes (P-value adjusted for multiple comparisons 0.05); A subset of randomly selected phenotypes was labeled for context.
Genetic Factors
Last year, we reported three significant hits from the “resolver” GWAS, and did not detect any in the “adherer” one. We now re-ran these analyses using a larger sample, while controlling for age, sex, age*sex interaction, genetic ancestry, and the version of genotyping platform.
We replicated last year’s top two findings located adjacent to the genes BRINP2 and CCDC62, respectively. BRINP2 is associated with both schizophrenia and openness to trying new things. We also identified 12 additional variants that reached genome-wide significance in the “resolver” GWAS (Figure 4). For these new hits, several associations involved genes expressed in the brain and implicated in physical or mental well-being.
For example, DCC plays a role in brain development and was previously reported to associate with smoking cessation and several well-being phenotypes, including life satisfaction, neuroticism, positive affect, and depression. While ubiquitously expressed in the brain, C11orf49 has been linked to feeling fed up, emotionally hurt, miserable, as well as BMI. SLC4A1 has been previously reported as a predictor of body fat distribution, and both DCC and SLC4A1 have been linked to educational attainment and intelligence. Another hit was found in C11orf80, which is related to the likelihood of participating in moderate to vigorous physical activity. Finally, we also found hits in regions associated with the general tendency to take risks, including BHLHE22, LRP8, and LRRTM4.
For the adherer phenotype, we still did not obtain any genome-wide significant hits this year. As our GWAS sample size continues to grow, our scientists will be well-positioned to identify novel genetic variants associated with such behaviors, but the effect of such individual variants is not likely to be dramatic.
Summary and Next Steps
In summary, we found that New Year’s resolutions are associated with some genetic and many environmental factors. Surprisingly, we found that most resolutions were not made (or kept) by people who reported unhealthy habits, but by those who were more conscientious — and already pretty healthy. However, New Year’s resolution behaviors might also be influenced by factors related to resolutions themselves, including setting unrealistic goals and not seeing immediate rewards.
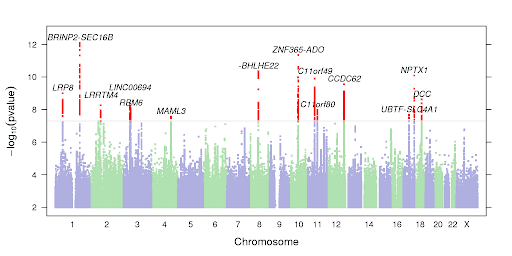
Figure 4: Genome-wide association study Manhattan plot for the “resolver” phenotype; Question: Did you make a New Year’s resolution this year? Possible responses were “yes” (n = 157,736) or “no” (n =504,194). This model treated the responses as binary variables, adjusting for age, sex, age*sex interaction term, genotyping platform, and the top 5 principal components of genetic ancestry.
For example, it is unlikely that total couch potatoes will succeed with a New Year’s resolution along the lines of “running five times per week.” Given that many of the habits that form New Year’s resolutions are notoriously hard to change overnight, many resolvers will also lose motivation after a few days if they do not see immediate rewards. The solution? Take your New Year’s resolution on a low-key “dry run” before January 1st to give yourself a head start (after all, the first few days are likely to be the hardest, so get that out of the way) and tweak your goals if necessary to improve your chances of success in 2020.
To further advance our understanding of New Year’s resolution-related behaviors, we will continue collecting data on them in March of 2020, adding questions to assess particular types of resolutions and underlying motivations. We would love for all 23andMe research participants to help us study and rock New Year’s resolutions together in the coming years!
*Yunru Huang is a scientist in Biostatistics at 23andMe. Robert Gentleman, Ph.D., is 23andMe’s vice president of computational biology, and Stella Aslibekyan is a Genetic Epidemiologist on our research team.
Limitations: Our study has several limitations that impact the interpretation of these findings. First, older females were more likely to respond to New Year’s resolution questions. For instance, people over 50 years old were 27% more likely to report their resolver status (OR = 1.27; P-value < 2e-16), and 51% more likely to answer questions about adherence (OR = 1.51; P-value < 2e-16), compared to those who were younger. Similarly, females were 30% more likely to report whether they made resolutions (OR = 1.30; P-value < 2e-16), and 32% more likely to say whether they stuck with their goals (OR = 1.30; P-value < 2e-16) compared to males. These findings point to possible response bias, as well as limit the generalizability of our findings to the general U.S. population. Second, we have yet to collect data on specific types of New Year’s resolutions, which may provide further insights into this popular behavior. Third, due to reporting on cross-sectional data, we were limited in inferring both temporality and causality from observed associations. For example, it was possible that participants reported being a current smoker before, but had already quit at the time of answering our New Year’s resolution questions. Finally, for sample size reasons, we limited our analysis to participants of European descent, and future studies should include more diverse cohorts.


